Markets as Coupled Oscillators
Overview
The goal of this project is to apply my physics experience to finance by modeling interconnected global markets as a network of coupled oscilllators (think pendulums together on a string). By analyzing key metrics such as the resulting coupling matrix \(K\), one can uncover underlying coupling strengths between markets, explore the synchronization of markets, and perform stability analysis on the system as a whole. This is not meant to predict prices, but rather probe the dynamics of the system within a given period of time.
Problem Statement
Synchronization in financial markets refers to the extent to which the behaviors of different assets or markets become correlated over time. As synchronization increases, the movements of individual stocks become more dependent on one another, reducing effective diversification. This interdependence can amplify systemic risk: a local shock to one asset or sector may propagate through the network, triggering broader market instability. For instance, if stock A is strongly coupled to stock B, a significant decline in B's price may lead to a corresponding drop in A's price, even in the absence of new information. High synchronization across markets may thus signal a fragile equilibrium, where localized disturbances lead to global cascades. In contrast, low synchronization implies greater robustness, as idiosyncratic shocks are more likely to remain contained. To quantify synchronization between financial markets, this project attempts to treat financial markets as a network of coupled oscillators whose phase (movement) is governed by the Kuramoto model. The Kuramoto model is a model for the behavior of a large set of coupled oscillators, shown here:
where \(\dot{\theta}_i\) is the time derivative of oscillator i's phase, \(\omega_i\) is the natural frequency, N is the number of oscillators, and \(K_{ij}\) is the coupling matrix that describes how strongly correlated oscillator i and j are. There are assumptions in this model, including that the oscillators are identical or nearly identical and that the interactions depend sinusoidally on the phase difference between each pair of oscillators. As it stands, my Kuramoto model does not include a white noise parameter and is purely deterministic. Future tweaks and inclusions of noise parameters may be desired or necessary for better representation of the stochastic nature of financial markets.
Technical Approach
Key Components:
- Bayesian Optimization: Used Gaussian Process-based optimization to intelligently search the hyperparameter space.
- Hidden Markov Monte Carlo: Sampled from the posterior distributions of the model parameters.
Model Procedure
This model can take N number of financial markets from the Yahoo! finance (yfinance python package). It has been tested on weekly closing prices for up to N = 10 major stock indexes, including ^GSPC, ^IXIC, ^FTSE, and others. Naturally, a high level of synchronization is expected among indexes, as each index aggregates the behavior of numerous underlying stocks. Testing on individual stocks would also be interesting, especially stocks from a diverse set of industries.
Since the current model is purely deterministic, I apply a third-order Savitzky–Golay filter over a 10-week window to smooth the price data for improved fitting. The objective is to analyze global synchronization and large-scale movements rather than local fluctuations, so smoothing should be appropriate as long as it does not obscure these broader trends.
After smoothing, I take the logarithm of the prices, \(log(P_i(t))\) , and subtract the mean across all assets at each time step, yielding \(\theta_i = log(P_i(t)) - E(log(P_i(t)))\). This normalization step mitigates differences in absolute price levels between markets or stocks, aiding numerical stability during fitting. Importantly, it does not alter the underlying Kuramoto dynamics, which are invariant under uniform (vertical) shifts across oscillators. The parameters \(\omega_i\) and \(K_{ij}\) are then extrapolated.
Results & Impact
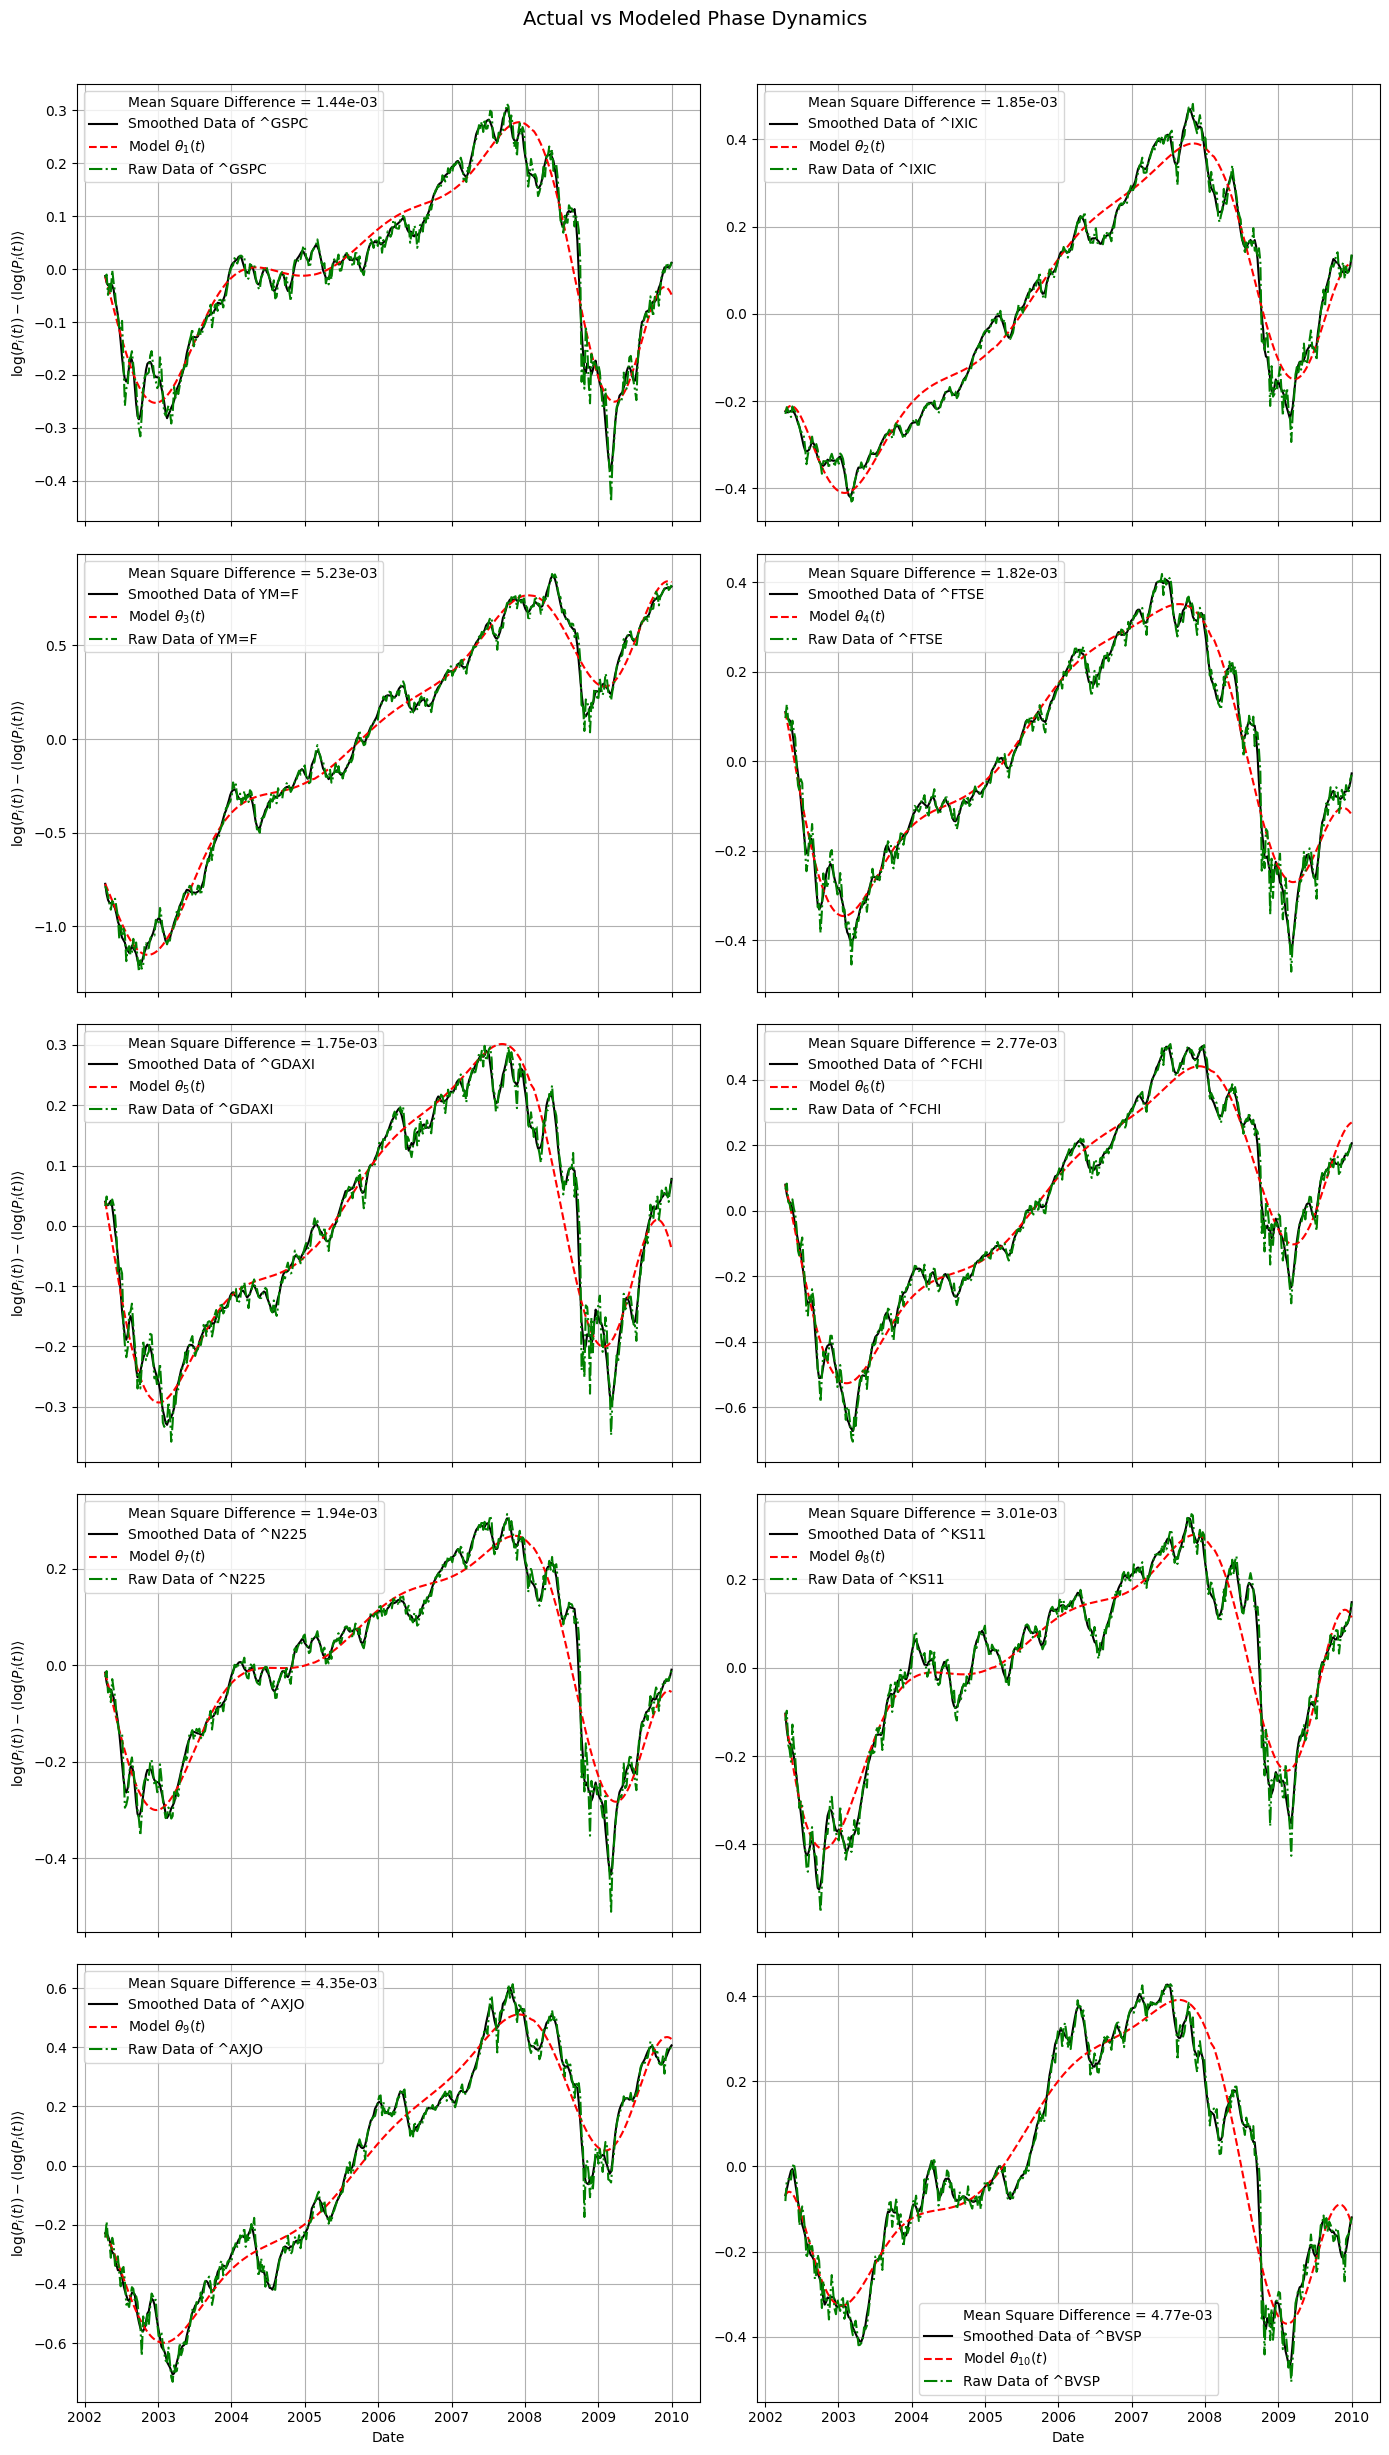
Figure 1: The Kuramoto model fit to weekly closing prices of 10 market indexes.
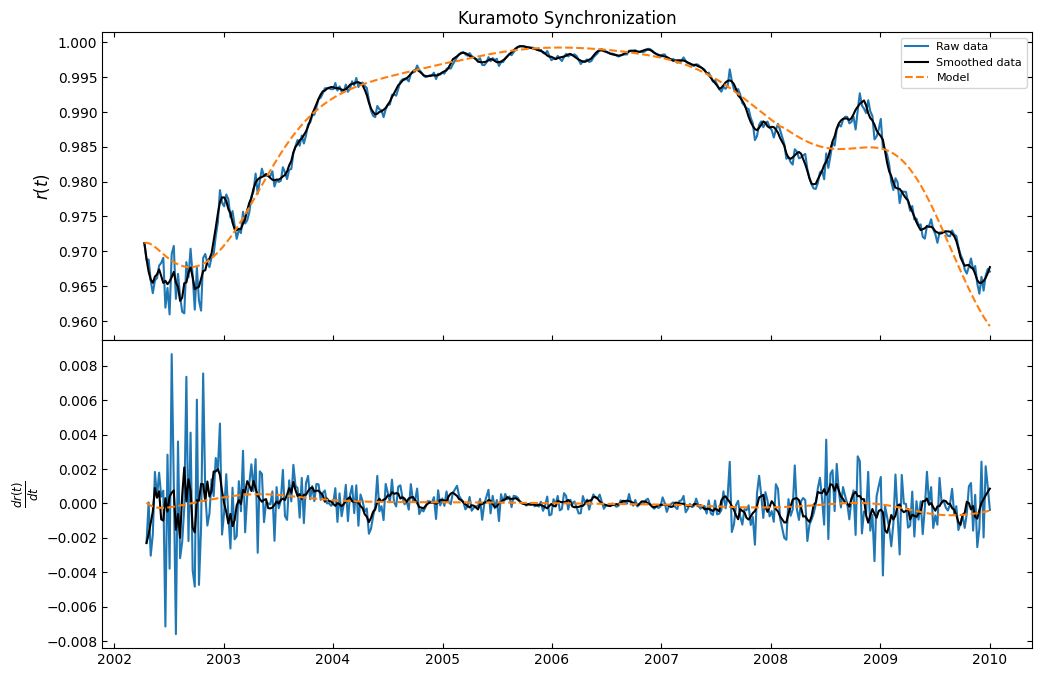
Figure 2: The order parameter that measures general synchronization among all the indexes over time.
Figure 1 shows the results of fitting the model to ten different indexes with their tickers displayed. We can see that the model does a good job of following the general shape of the markets, which helps validate the idea that these markets are directly interconnected and whose movements influence all other models. We can further probe the systemic synchronization by calculating the order parameters \(r\) and \(\phi\). They are defined as:
where \(r\) represents the phase-coherence and \(\phi\) is the average phase of the oscillators. \(r\) can have values between 0 (uncoupled) and 1 (full phase-locking). Figure 2 shows the order parameter \(r\) and the change in \(r\) over time. We can see a collective synchronization beginning around 2004 until around 2008. This could show how collective synchronization leaves markets vulnerable to shocks in one or more markets. In this case, the housing market crashed in 2008, which had massive effects across many markets, not just housing.
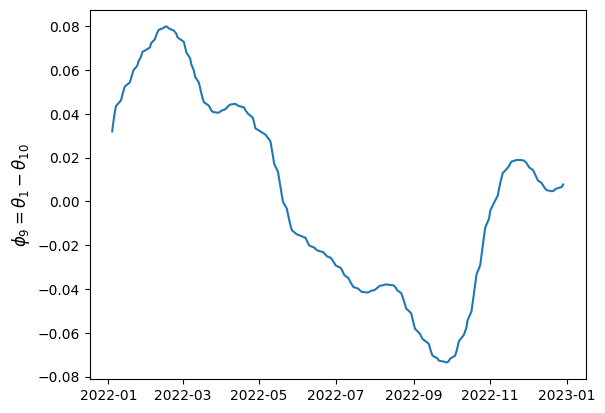
Figure 3: The phase difference between two markets labelled 1 and 10.
We can continue to probe synchronization between individual markets by plotting the phase differences of each. An example of can be seen in Figure 3. Ideally, if there is a convergence, then we can say the markets are "phase-locked" - meaning they are strongly coupled. If there is no convergence, then they are not strongly coupled. If the curves experience a sinusoidal behavior with fixed amplitude, it could be indicative of quasi-periodicity, which could imply a few things: (1) they are not completely independent, but they are not perfectly synchronized; (2) one market may consistently lead or lag the other by a varying amount, creatnig a cyclical pattern in their relative behavior; (3) the markets could be in an intermediate state between strong synchronization and complete uncoupling.